Line Drawing 1

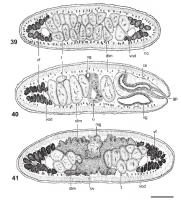
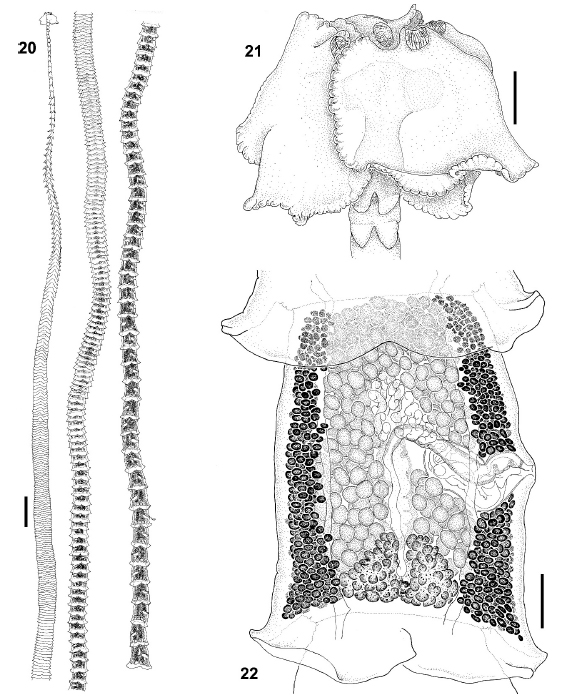
FIGURES 2022. Crossobothrium pequeae n. sp. (20) Entire worm, scale bar = 1.6 mm. (21) Scolex, scale bar = 200 µm. (22) Mature proglottid, scale bar = 200 µm. |
Line Drawing 2
FIGURES 3238. Crossobothrium pequeae n. sp., scanning electron micrographs. (32) Anterior region of strobila showing the variation in immature proglottid shape, from anterior to posterior (ac), scal... MoreFIGURES 3238. Crossobothrium pequeae n. sp., scanning electron micrographs. (32) Anterior region of strobila showing the variation in immature proglottid shape, from anterior to posterior (ac), scale bar = 1 mm. (3336) Detail of proglottid shape, from anterior (33) to posterior (36), scale bar = 200 µm. Small numbers in Figure 34 indicate locations of
details shown in Figures 37 and 38. (37) Surface of laciniations in immature proglottid, scale bar = 1 µm. (38) Surface of anterior half of
immature proglottid, scale bar = 1 µm. |
Photo Micrograph
|
Scanning Electron Micrograph
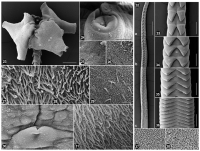
FIGURES 2331. Crossobothrium pequeae n. sp., scanning electron micrographs. (23) Scolex, scale bar = 250 µm. Small numbers indicate locations of details shown in Figures 2731. (24) Detail of accesso... MoreFIGURES 2331. Crossobothrium pequeae n. sp., scanning electron micrographs. (23) Scolex, scale bar = 250 µm. Small numbers indicate locations of details shown in Figures 2731. (24) Detail of accessory sucker, scale bar = 50 µm. Small numbers indicate locations of details shown in Figures 25 and 26. (25) Inner surface of accessory sucker, scale bar = 2 µm. (26) Outer surface of accessory sucker, scale bar = 2 µm. (27) Distal bothridial surface near the margin, scale bar = 2 µm. (28) Distal bothridial surface at midway between margin and center, scale bar = 2 µm. (29) Distal bothridial surface at the center of bothridium, scale bar = 2 µm. (30) Distal bothridial surface showing gradual change on microthrix size and density, sale bar = 10 µm. (31) Proximal bothridial surface, scale bar = 2 µm. |
 FIGURES 2022. Crossobothrium pequeae n. sp. (20) Entire worm, scale bar = 1.6 mm. (21) Scolex, scale bar = 200 µm. (22) Mature proglottid, scale bar = 200 µm.
  FIGURES 3238. Crossobothrium pequeae n. sp., scanning electron micrographs. (32) Anterior region of strobila showing the variation in immature proglottid shape, from anterior to posterior (ac), scale bar = 1 mm. (3336) Detail of proglottid shape, from anterior (33) to posterior (36), scale bar = 200 µm. Small numbers in Figure 34 indicate locations of
details shown in Figures 37 and 38. (37) Surface of laciniations in immature proglottid, scale bar = 1 µm. (38) Surface of anterior half of
immature proglottid, scale bar = 1 µm.
FIGURES 3238. Crossobothrium pequeae n. sp., scanning electron micrographs. (32) Anterior region of strobila showing the variation in immature proglottid shape, from anterior to posterior (ac), scale bar = 1 mm. (3336) Detail of proglottid shape, from anterior (33) to posterior (36), scale bar = 200 µm. Small numbers in Figure 34 indicate locations of
details shown in Figures 37 and 38. (37) Surface of laciniations in immature proglottid, scale bar = 1 µm. (38) Surface of anterior half of
immature proglottid, scale bar = 1 µm. 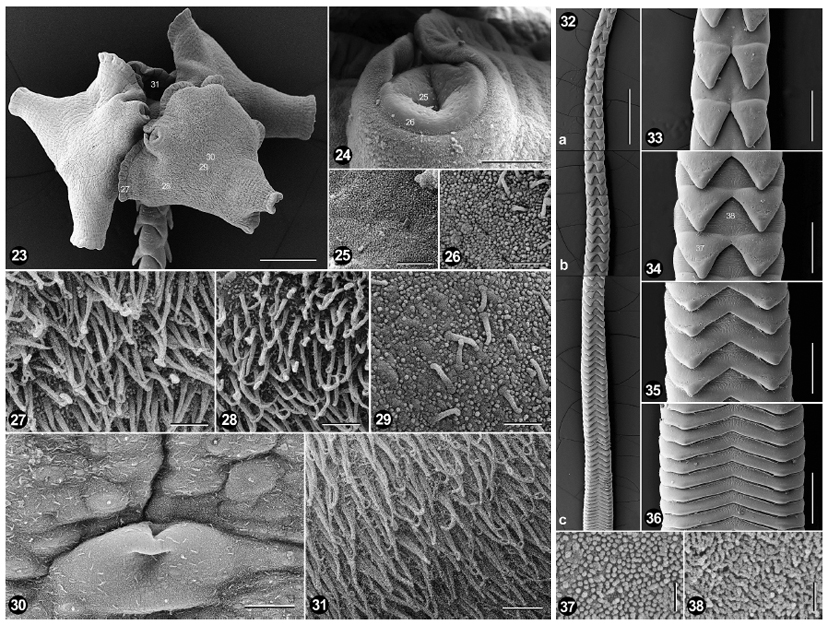 FIGURES 2331. Crossobothrium pequeae n. sp., scanning electron micrographs. (23) Scolex, scale bar = 250 µm. Small numbers indicate locations of details shown in Figures 2731. (24) Detail of accessory sucker, scale bar = 50 µm. Small numbers indicate locations of details shown in Figures 25 and 26. (25) Inner surface of accessory sucker, scale bar = 2 µm. (26) Outer surface of accessory sucker, scale bar = 2 µm. (27) Distal bothridial surface near the margin, scale bar = 2 µm. (28) Distal bothridial surface at midway between margin and center, scale bar = 2 µm. (29) Distal bothridial surface at the center of bothridium, scale bar = 2 µm. (30) Distal bothridial surface showing gradual change on microthrix size and density, sale bar = 10 µm. (31) Proximal bothridial surface, scale bar = 2 µm.